
How many patients do we need?
POWER ANALYSIS FOR SAMPLE SIZE
1) Determine what is to be the ‘Principal Outcome measure’.
Often trickier than statisticians expect! There may he several measures of equal clinical importance Which measure is the new treatment most likely to influence? It is better to calculate numbers for each measure than to try to combine measures into a single scale.
2) Judge a realistic ‘true difference’ between the treatments.
Possibly the most annoying question a statistician will ask. The response is usually ‘‘If I knew the difference I wouldn’t need to do a trial!" What we mean is ‘How much difference would there really have to he to make it worthwhile concluding that there is a difference?’. For example, if the current treatment has an 80% success rate, is it worth knowing that a new treatment has an 81% success rate? This will depend on all sorts of’ things: gravity of outcome; side effects; relative convenience to patients and staff; and finances, How big a difference would persuade you to change routine practice?
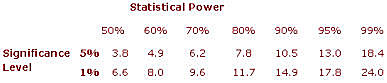
3) Select (arbitrary) statistical power and significance levels.
Even if there really is a difference between treatments, you may be unlucky and miss it. The more patients you study, the higher the chance you wont miss it. This chance is the STATISTICAL POWER of the study. Significance level is conventionally set at 5% (p<0.05) Similarly, power is conventionally at least 80%, sometimes 90%, and only rarely 95%. There is no logical reason for these conventions.
4) Use appropriate equation for chosen outcome measure.
Examples using the two most common equations are below. You can twist almost all studies to fit one of these, Given the guesswork in coming up with realistic treatment differences, concern with exact equations for all possible research designs seems futile.
5) Wonder why required number of patients is so high!
If the numbers aren’t much higher than anticipated then check your calculations!
Is your estimate of true difference’ wildly optimistic? Most research is hopelessly underpowered. Only with huge advances in care can small single centre studies establish the benefits. If you can’t recruit the requited numbers you might consider this as pilot work to determine whether there is sufficient promise to justify major funding. Otherwise, if you really want the answer, you may need to find collaborators locally or nationally.
CALCULATIONS
1) Comparing proportion of 'successes': 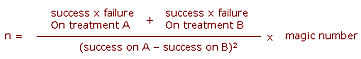
Trials with n patients in each of two groups
2) comparing means of normally distributed outcome: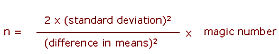
What if there is no pilot data, preliminary reports or previous literature on which to base your estimate of the standard deviation? One rule of thumb is that the standard deviation will be about one quarter of the range of usual measurements For example, if the mean on current treatment is about 80, and you’d anticipate 95% of people to score between 60 and 100 (range=40), thea the standard deviation is about 10.
Magic Number
This value is determined by the required power and significance level. For common values it is tabulated below:
EXAMPLE
Consider a trial looking for improvement from 85% success rate on the current treatment (A) to 90% on a new treatment (B), and requiring an 80% chance of detecting a difference at the 5% significance level (p<0.05).
From first formula and table:
NOTE that this is per treatment. What if only 700 patients in total could he recruited - how would this affect the power of the study? Working the formula backwards, we have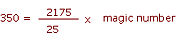
The magic number must he 40, and so, from the table, the power would be about 52%,
